A new map shows which states are projected to have big temperature rises over the next 30 years due to climate change.
The map, based on projections by the U.S. Global Change Research Program (USGCRP), shows how temperatures might rise over the century, depending on levels of emissions.
In a lower emissions scenario, by 2040-2059 nearly all of Minnesota and parts of North Dakota, South Dakota, Iowa, Wisconsin and Utah would have temperature rises of 4 degrees Fahrenheit.
In a higher emissions scenario, in this time period the vast majority of states would see a temperature increase of 4 degrees. The only exceptions would be Washington, Florida, Georgia and South Carolina.
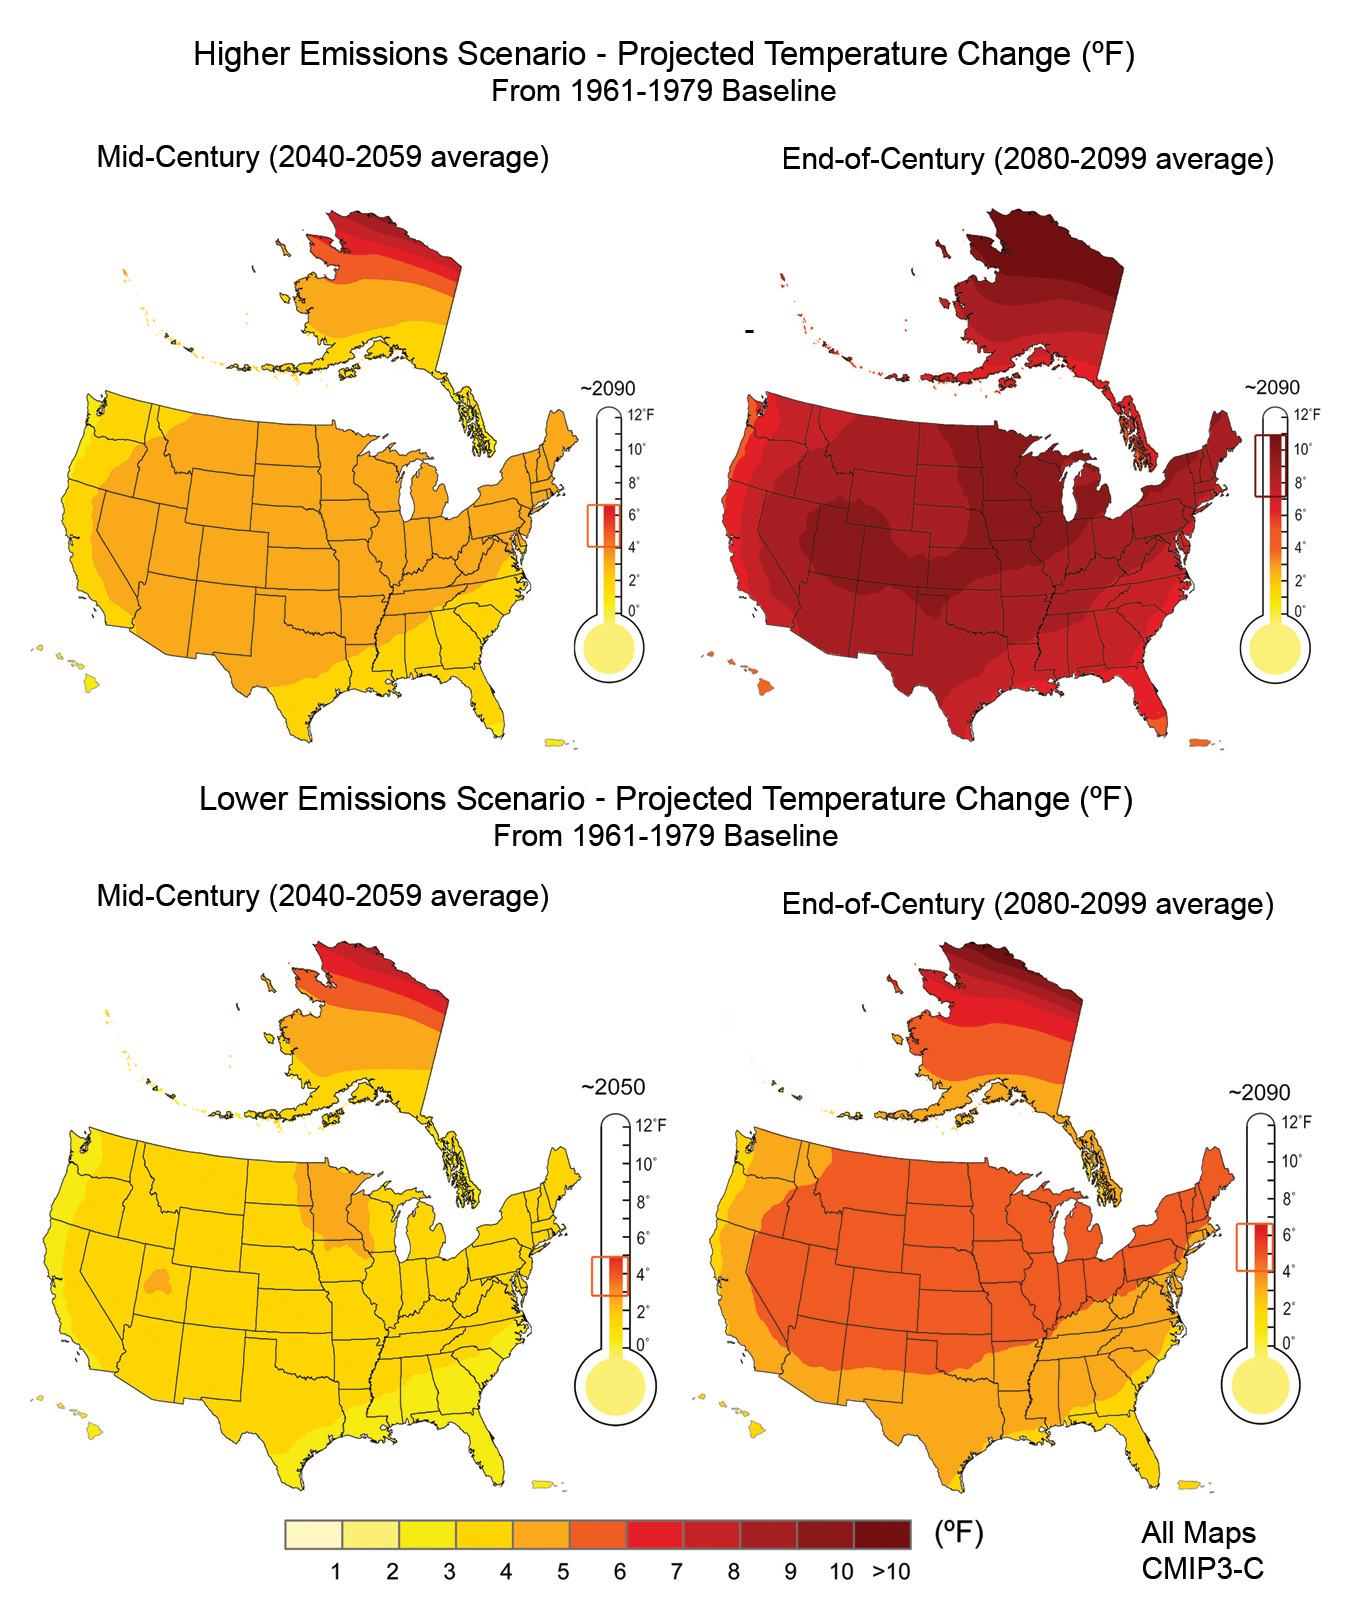
The map also shows how temperatures might rise by the end of the century.
In a lower emissions scenario, large portions of the country would see temperatures rise by 4-6 degrees, except for several states in the southeast.
In a higher emissions scenario, by 2080-2099 nearly the entire country would see temperature rises between 7-11 degrees.
Rising temperatures would cause ice caps to melt, sea levels to rise, and more frequent and intense extreme weather events, particularly heat waves or extreme heat events, according to the United States Environmental Protection Agency (EPA).
The map depicts different possible outcomes, which will depend on whether there is a reduction in greenhouse gas emissions in the coming decades.
With the exception of the most aggressive mitigation scenario considered, global average temperatures are expected to rise by at least twice the amount in the next 100 years compared to the increase observed over the past 100 years, according to the United Nations' Intergovernmental Panel on Climate Change.
If greenhouse gas emissions continue to grow, the U.S. is expected to experience much hotter summers than it has in the past.
USGCRP forecasts that summertime temperatures that were among the hottest 5% in 1950-1979 could be present at least 70% of the time by 2035 to 2064.
Human activities have caused significant increases in greenhouse gas emissions, particularly carbon dioxide. In the U.S., the primary sources of emissions are transportation and electricity, according to the EPA.
Human-caused emissions have slightly decreased in the U.S. since 1990, the EPA noted. However, globally, greenhouse gas emissions have surged.
In response to the 2023 Emissions Gap report, United Nations Secretary-General António Guterres called on countries worldwide to take more action to slow emissions.
He said countries should commit to tripling renewables capacity, doubling energy efficiency and bringing clean power to all by 2030.
"Present trends are racing our planet down a dead-end three-degree temperature rise. The report shows that the emissions gap is more like an emissions canyon," he said.
Uncommon Knowledge
Newsweek is committed to challenging conventional wisdom and finding connections in the search for common ground.
Newsweek is committed to challenging conventional wisdom and finding connections in the search for common ground.
fairness meter
To Rate This Article